A vibrant graphic with the CBCA logo in the center, showing a dancer on the left, people viewing art on the right, and a musician playing a guitar. Text reads: "Economic Activity Study of Metro Denver Culture.

CBCA’s Economic Activity Study of Denver Metro Culture is a biennial report that quantifies the economic contributions that arts and culture make on the Denver metro area. In collaboration with Scientific & Cultural Facilities District (SCFD), CBCA has been demonstrating the social and financial impact of the arts on our region since 1993. 

Economic Activity Study of Metro Denver Culture

On November 6, 2025, Colorado Business Committee for the Arts (CBCA) released its latest Economic Activity Study of Metro Denver Culture, presented by U.S. Bank, at a sold out community roll-out event at the Denver Art Museum.

Explore the Report

In collaboration with Scientific & Cultural Facilities District (SCFD), CBCA has been demonstrating the social and financial impact of the cultural sector on our region for over 30 years. The most recent study illustrates how arts, culture and scientific nonprofit organizations are impacting the local economy and contributing to employment, education, tourism, cultural engagement and overall economic activity, especially considering the lingering effects of the COVID-19 pandemic and amid uncertain times.

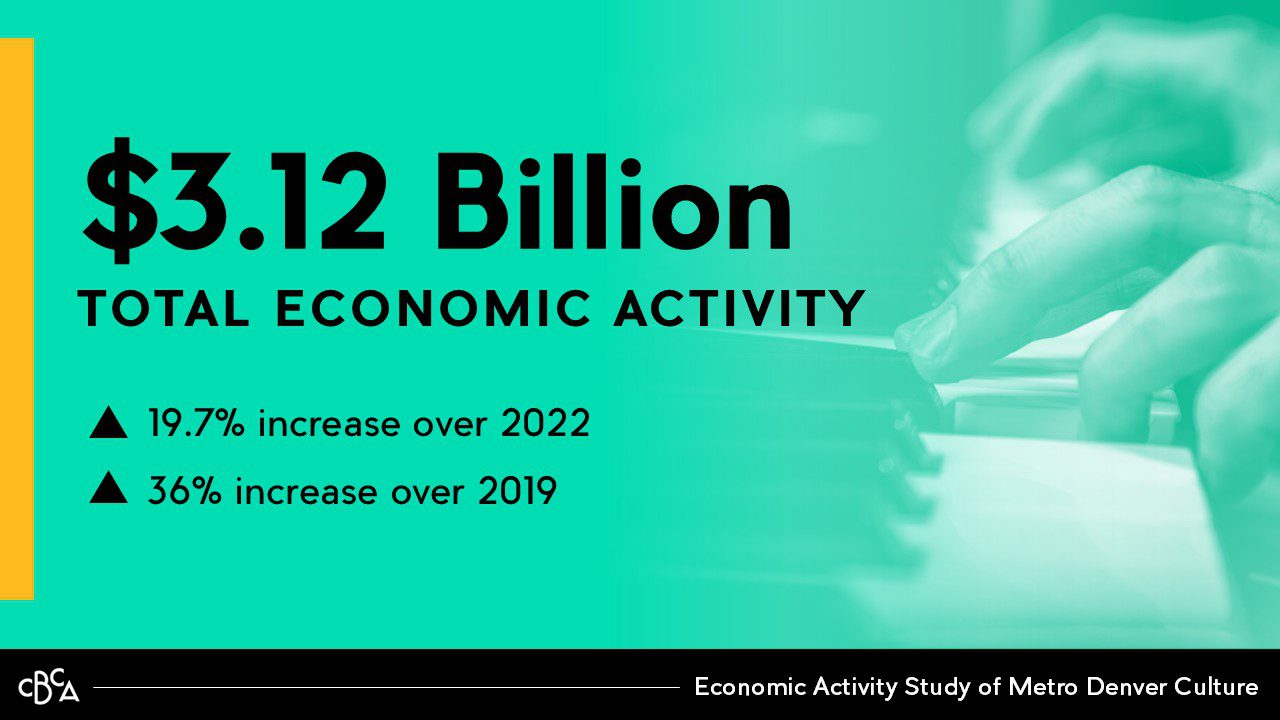
SOARING ECONOMIC ACTIVITY

Economic activity generated by the cultural sector continues to grow in 2024, reaching a record-breaking of $3.12 billion and sustaining the post-pandemic recovery. Economic activity is driven by direct and indirect audience spending and operating expenditures. This growth persists despite fluctuations in capital expenses.

Infographic showing "$3.12 Billion Total Economic Activity" with a 19.7% increase over 2022 and a 36% increase over 2019. A faded image of hands playing piano is in the background.

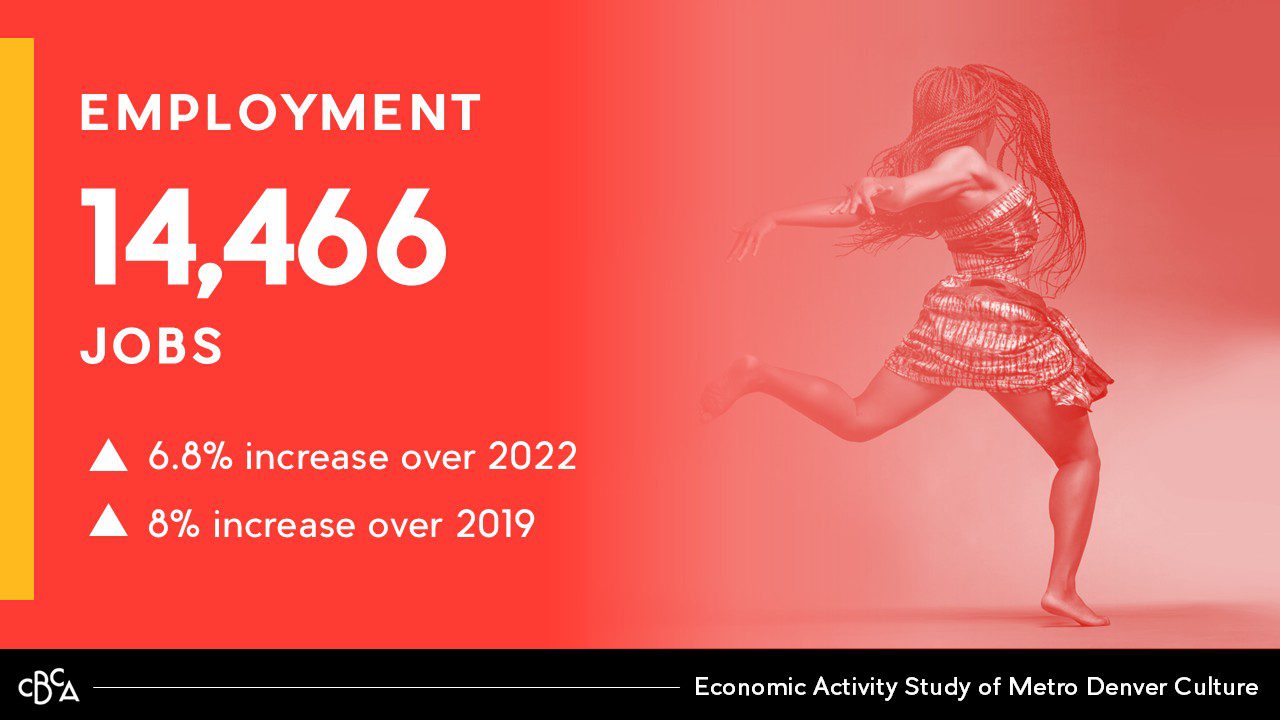
MORE JOBS IN ARTS & CULTURE

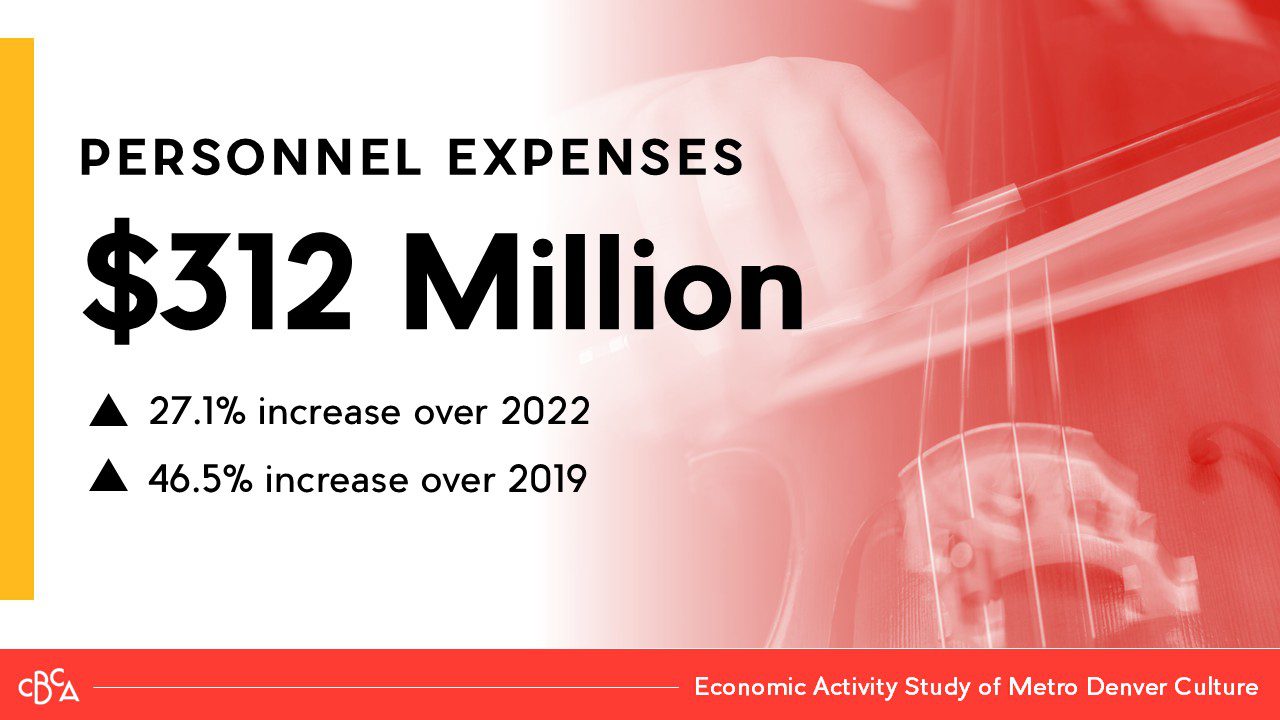
Total employment at arts, culture and scientific organizations is at an all-time high at 14,466 jobs. There has been growth across full-time, part-time and contract jobs from 2022 to 2024. Full-time and contract employment have exceeded rates seen in 2019 before the pandemic. Personnel costs are outpacing the growth in total employment.


A graphic showing "Employment 14,466 jobs" with a 6.8% increase over 2022 and 8% increase over 2019. On the right, a woman in a dance pose. Text at the bottom reads Economic Activity Study of Metro Denver Culture.

Infographic showing “Personnel Expenses $312 Million,” with a 27.1% increase over 2022 and a 46.5% increase over 2019. Background features a close-up of a person playing a string instrument.

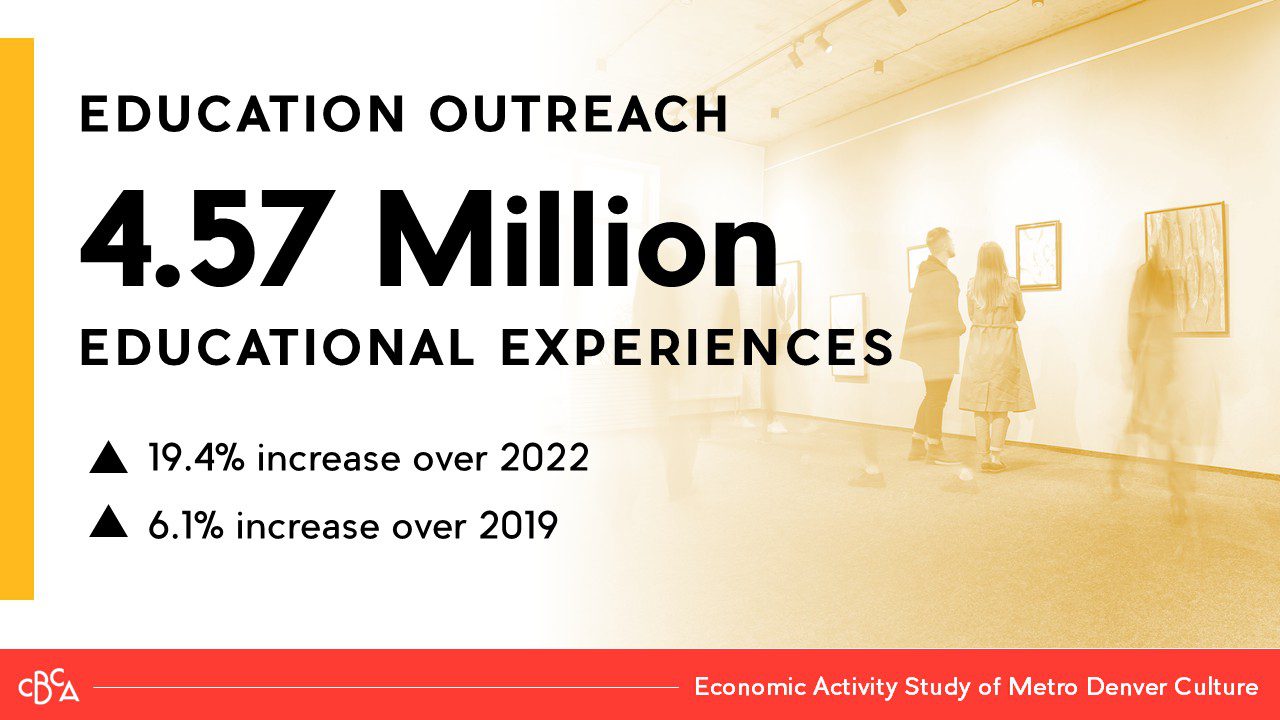
ATTENDANCE, EDUCATION & TOURISM

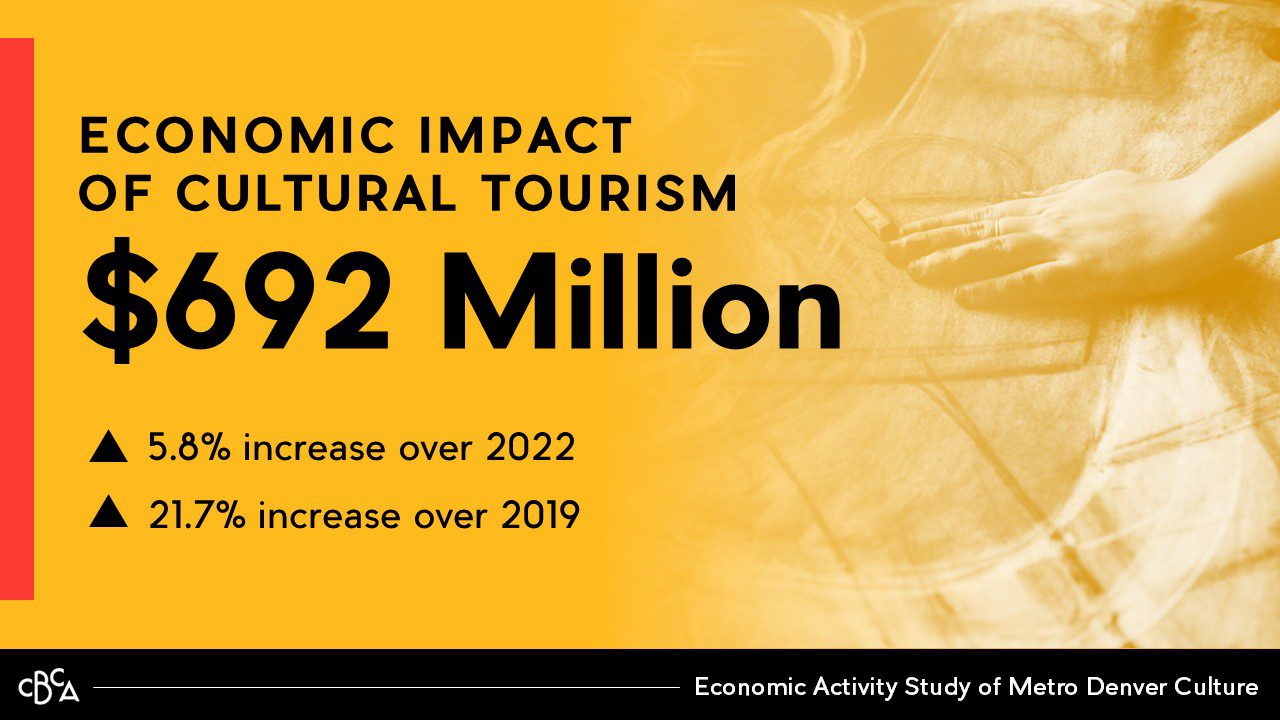
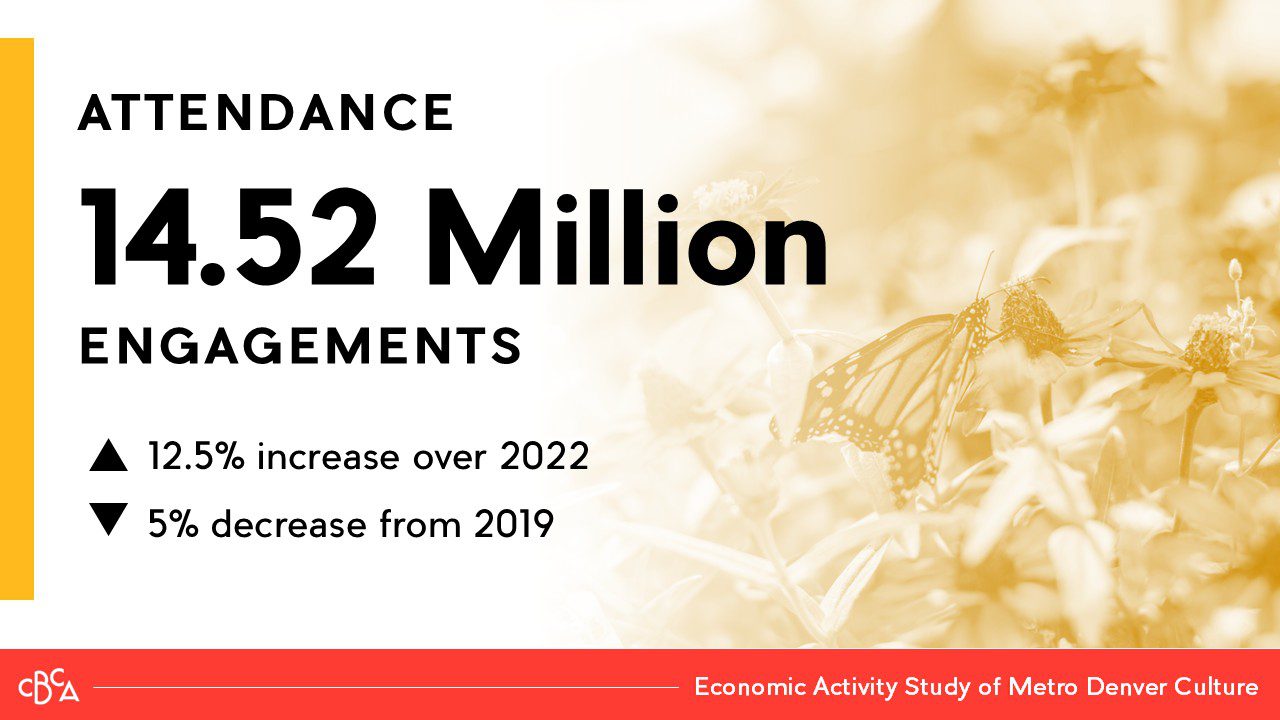
Participation in arts and culture experiences has steadily increased across the region, and total audience engagement is almost back to pre-pandemic levels at 14.52 million engagements. Education outreach and school programming have bounced back and are at a record high at 4.57 million educational experiences. The economic impact of cultural tourism is up to $692 million in 2024 thanks to direct and indirect spending of audiences from outside the Denver metro area, Colorado and internationally.

Yellow graphic with text: “Economic Impact of Cultural Tourism $692 Million.” Subtext shows a 5.8% increase over 2022 and a 21.7% increase over 2019. Faint image of a hand on fabric in the background.

Infographic showing 14.52 million cultural event engagements, a 12.5% increase over 2022 but a 5% decrease from 2019, from the Economic Activity Study of Metro Denver Culture. Background features a butterfly and flowers.

Infographic shows "Education Outreach: 4.57 million educational experiences," with a 19.4% increase over 2022 and 6.1% increase over 2019. Faded background shows people viewing art in a gallery.


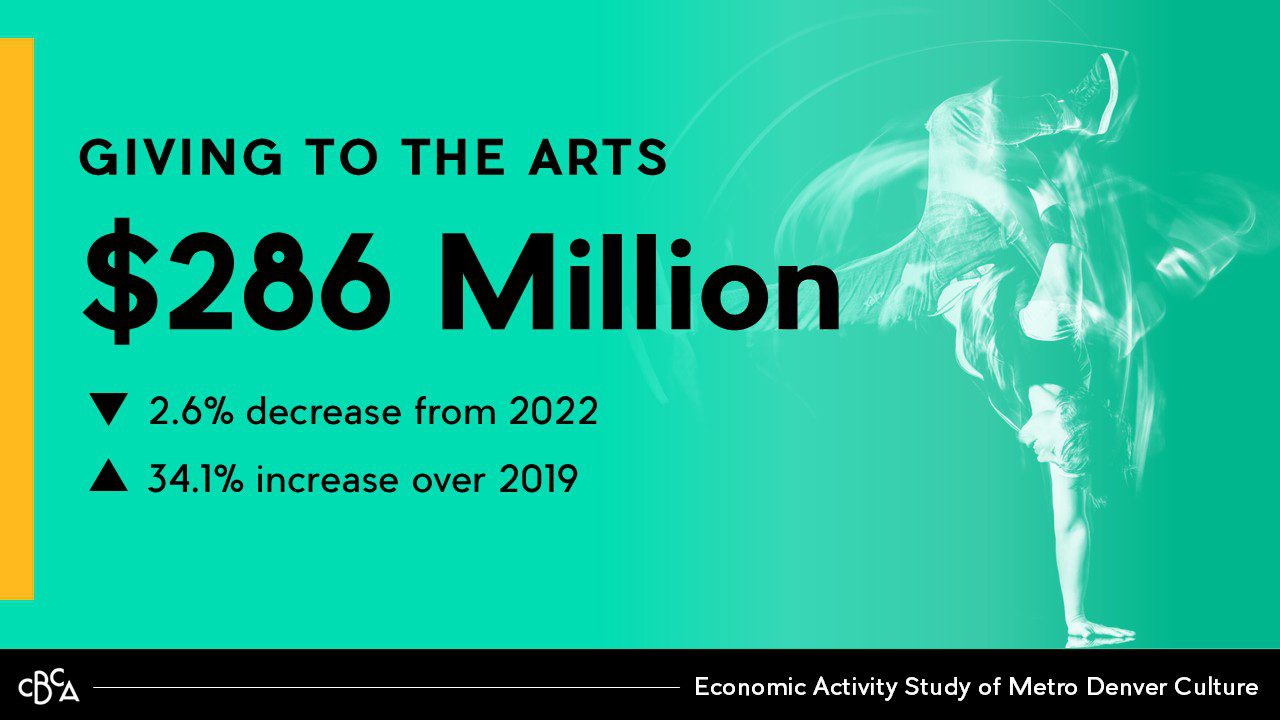
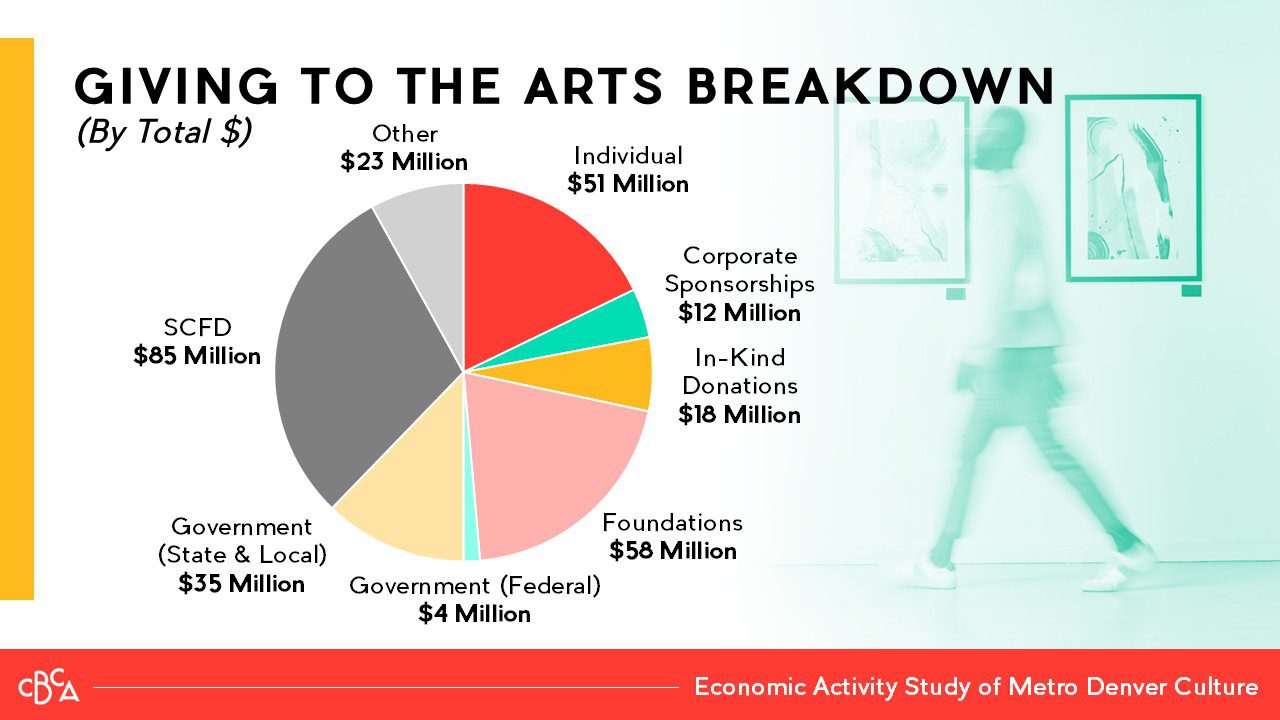
GIVING TO AND SUSTAINING CULTURE FOR ALL

Total giving to arts, culture and scientific organizations was $286 million in 2024. Organizations saw a dramatic drop in federal government funding in 2024 as pandemic-related relief programs have gone away (90% decrease from 2022). Donations from individuals and foundations are helping to fill that gap and increased significantly from 2022 to 2024 at 10.7% and 36.4% respectively. Corporate sponsorships increased only slightly, 3.8%, in that same two-year period. SCFD remains the largest single funding source for arts, cultural and scientific organizations in the region, consistently providing stability and momentum.

Infographic showing "Giving to the Arts: $286 Million," with a 2.6% decrease from 2022 and a 34.1% increase over 2019. Background features a teal-toned image of a dancer.Pie chart showing breakdown of arts funding: Individual $51M, Corporate Sponsorships $12M, In-Kind Donations $18M, Foundations $58M, Federal Gov’t $4M, State & Local Gov’t $35M, SCFD $64M, Other $23M.

Media Coverage

  • “Getting Down to Business: Arts Contributed More Than $3 Billion to Colorado’s Economy in 2024” Westword
  • “Colorado’s cultural sector is so successful, it attracts 3 times more attendees than our professional sports teams combined” Colorado Public Radio
  • “Denver museums and arts hit new economic milestone, but visits still down” Denver Gazette

Invite CBCA to your meeting!

CBCA staff are able to present this data in-person or virtually to chambers of commerce, economic development councils, city councils, boards of directors, or other civic, cultural or business groups across the region. Please submit this presentation request form or contact CBCA at main@cbca.org to learn more or schedule a presentation.

Methodology

Released in November 2025, CBCA’s latest Economic Activity Study of Metro Denver Culture is calculated using data from the 2024 calendar year. Data is self-reported by the nearly 300 arts, culture and scientific nonprofits funded by the SCFD in a seven-county region: Adams, Arapahoe, Boulder, Broomfield, Denver, Douglas and Jefferson Counties. Comparisons are made to CBCA’s prior studies, which include data from the 2019, 2020 and 2022 calendar years, as well as CBCA’s 30-year longitudinal dataset. This study does not include data from non-SCFD funded nonprofits, for-profit creative businesses, higher education or individual artists. Economic activity and impact are calculated using Regional Input-Output Modeling System (RIMS II) multipliers from the U.S. Bureau of Economic Analysis. The data analysis and research were conducted by BBC Research and Consulting.

Thank You to our Sponsors

Thank you to the Presenting Sponsor, U.S. Bank, for making this report and the roll-out event possible! We are grateful to all of the 2025 Economic Activity Study sponsors: Pinnacol Assurance, Colorado Educational and Cultural Facilities Authority (CECFA), VISIT DENVER, Denver Art MuseumDenver Botanic Gardens, Denver Center for Performing Arts, Denver Museum of Nature and Science, Denver Zoo Conservation Alliance, Scientific & Cultural Facilities District (SCFD), East West Partners, and Fairfield & Woods. Thank you to the in-kind partners for supporting the study and roll-out event: GFM|CenterTable, The Publishing House and Rocky Mountain Public Media.