2021 Economic Activity Study of Metro Denver Culture
Economic Activity
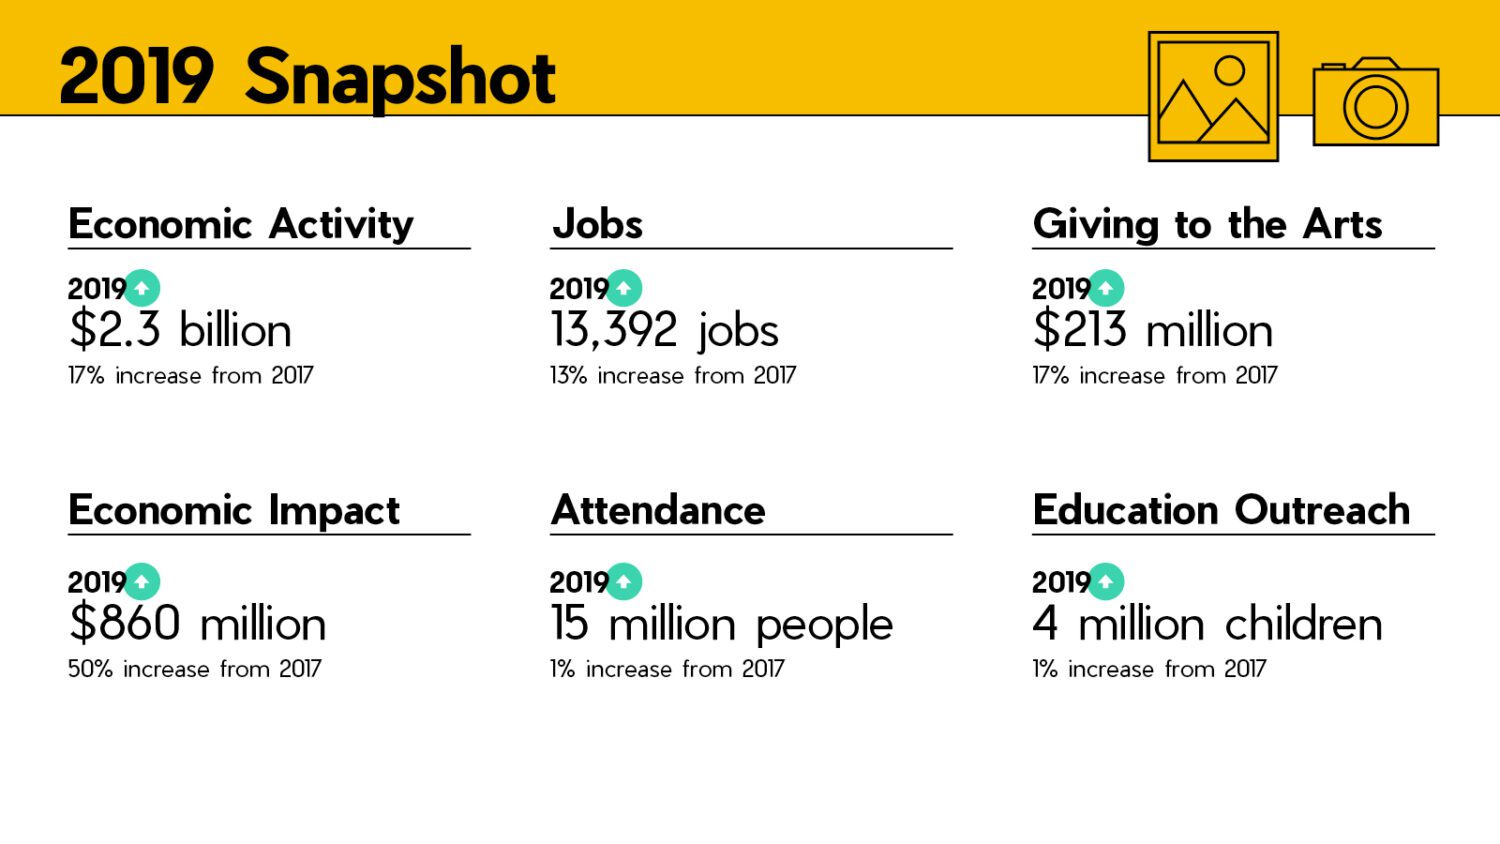
Economic Activity Snapshot
2019
Total Economic Activity: $2.3 billion
17% increase from 2017
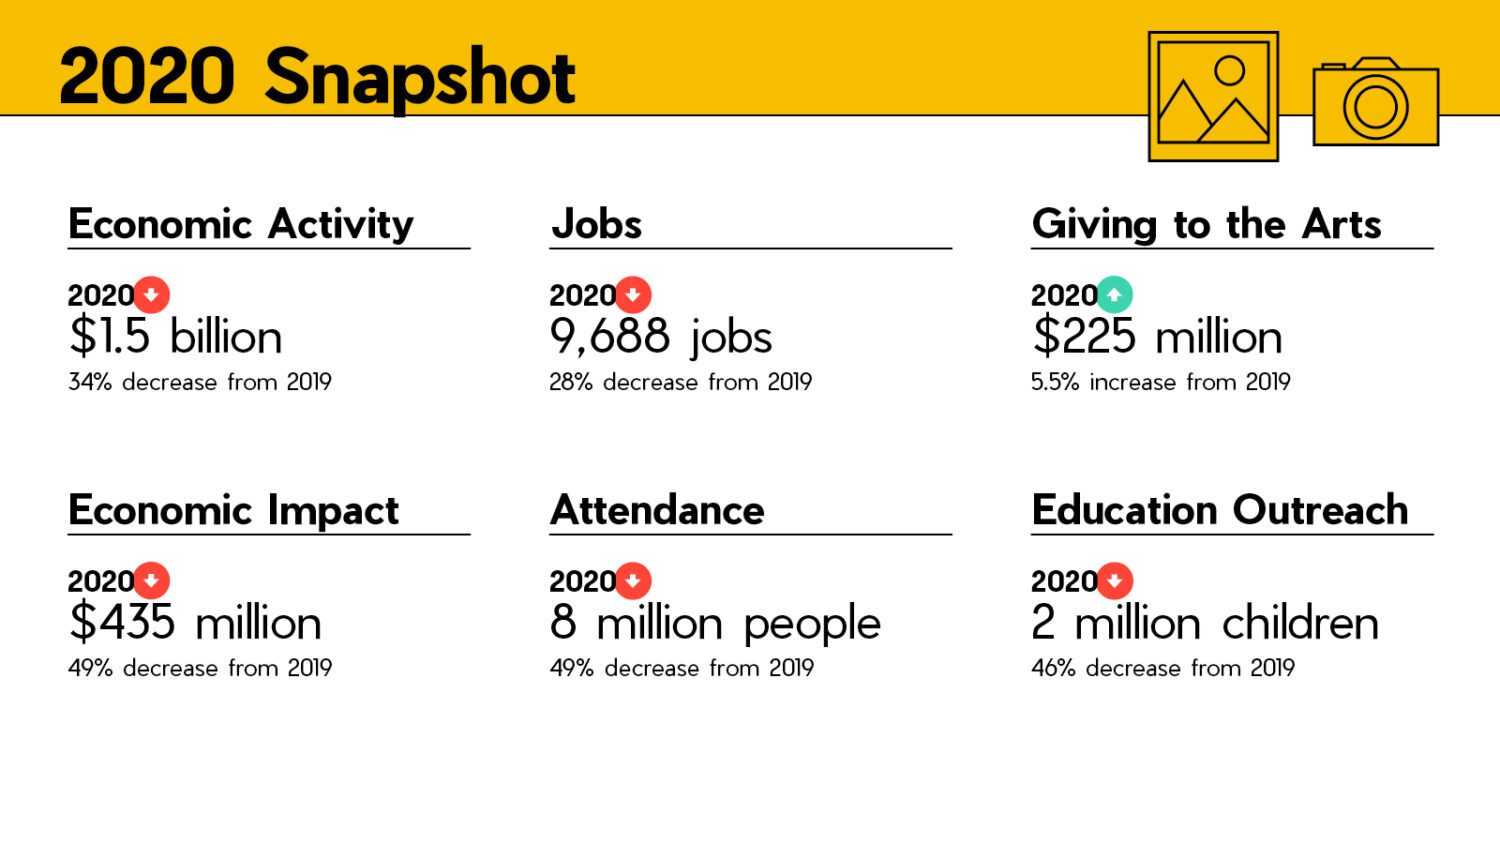
2020
Total Economic Activity: $1.5 million
34% decrease from 2019
Arts, cultural and scientific organizations fuel the region’s economy by generating vital economic activity.
Economic activity is comprised of three categories: Audience Spending, Operating Expenditures and Capital Spending.
Within each of these three categories, there is direct and indirect spending. Direct spending includes the cost to operate cultural programs, pay staff and contractors, and maintain facilities, as well as spending by audience members to enjoy these institutions and all of their offerings. Indirect or ancillary spending is the result of these direct expenditures. Every dollar spent by an arts, cultural or scientific institution has an economic ripple effect. Paying a local musician means she can buy groceries or pay rent. Buying materials for a theatre set or art exhibit injects money into the economy. When a person decides to participate in the arts, they, too, contribute to this ripple effect, whether it’s gas in their car, dinner before a show, happy hour after a museum, or staying overnight in a hotel. Indirect spending is estimated based on RIMS II multipliers from U.S. Bureau of Economic Analysis.
MONET: The Truth of Nature, Denver Art Museum. Photo Credit: James Florio
MONET: The Truth of Nature, Denver Art Museum. Photo Credit: James Florio
Economic Activity from arts, cultural or scientific institutions has been steadily growing year over year since the Great Recession, reaching a new record of $2.3 billion in 2019.
An increase in overall cultural participation, as well as a few major blockbuster arts events in 2019 led to increases in audience spending. For example, Denver Art Museum had two internationally acclaimed exhibits in the 2019 calendar year: Dior: From Paris to the World (Nov 2018-March 2019) and Claude Monet: The Truth of Nature (Oct 2019-Feb 2020). There was a 10% increase between 2017 and 2019 in economic activity generated from audience spending.
In 2020, economic activity dropped to levels parallel to the Great Recession, dropping to $1.5 billion, which is a 34% decrease from 2019. There was significantly less audience spending due to the temporary shutdown of venues and in-person events starting in March 2020 as a result of the COVID-19 pandemic. The economic ripple effect of arts activities was curtailed or, in some cases, halted altogether.
Most cultural organizations were still very busy during this time. While there was a 45% decrease in economic activity from audiences in 2020, there was only a 16% decrease from operating expenditures. Arts organizations were finding new ways to provide digital cultural programs, online arts and music classes and virtual performances! They found ways to transition their work outdoors and with new safety protocols.
However, it was challenging for many organizations to monetize digital events and virtual programs, and even harder to generate the same economic activity when people had to participate at home. Therefore, CBCA was not able to use the same economic multipliers for virtual arts events as in-person ones. There isn’t the same set of assumptions for ancillary spending on things like gas, parking, babysitting, meals and travel. It is for this reason that CBCA removed virtual attendance from the 2020 data.
Film on the Rocks, Denver Film. Photo Credit: From The Hip Photo
Film on the Rocks, Denver Film. Photo Credit: From The Hip Photo
Even during the height of the pandemic, Denver Film found ways to not just reach cultural audiences but generate that vital economic activity. Denver Film partnered with food and beverage delivery services to put together Dinner + A Movie packages. By purchasing a ticket to one of their featured movies on their virtual cinema platform, patrons could receive a coupon code for a food delivery service to bring a meal to their home, thus supporting local businesses.
Denver Film also found a way to continue their popular Film on the Rocks series by bringing back the classic drive-in movie theatre experience! Again, attendees were adding to that economic activity by purchasing food, putting gas in their car and spending a night out.
Average spending per person beyond admission is approximately $23.
Economic Impact
Economic Impact Snapshot
2019
Total Economic Impact: $860 million
50% increase from 2017
2020
Total Economic Impact: $435 million
49% decrease from 2019
Arts, cultural and scientific organizations bring in “new money” into the region, which is defined as economic impact. These valuable dollars would not be entering the regional economy if it weren’t for these SCFD-funded institutions.
Economic impact is comprised of three categories: Federal Government Grants, Cultural Tourism and Capital Expenditures
The economic impact of cultural tourists includes the spending from audience members, such as hotel stays and meals at restaurants, as well as a portion of organizational operating costs. Federal grants are traveling all the way from Washington, D.C., unlike state and municipal funds, which are already here. And capital spending represents investments above and beyond daily operations and programming.
Economic impact is a segment of total economic activity. The same direct and indirect multipliers are applied to this “new money” to calculate its ripple effect throughout the regional economy.
Freyer-Newman Center, Denver Botanic Gardens. Photo Credit: Scott Dressel-Martin
Freyer-Newman Center, Denver Botanic Gardens. Photo Credit: Scott Dressel-Martin
There were significant investments in 2019 and into 2020 on new building projects, renovations, and capital campaigns. Arts participation has been growing since the Great Recession and organizations started making huge investments in increased capacity, technological advancements and accessibility.
The economic impact of capital expenditures increased 272% from 2017 to 2019. This included the GO Bond initiatives passed by the City and County of Denver in 2017, which helped to fund renovations at the Denver Center for the Performing Arts, the overhaul of the Denver Art Museum’s North Building, and the new Animal Hospital at Denver Zoo and Freyer-Newman Center at Denver Botanic Gardens.
In 2020, there was also an unprecedented economic impact from federal grants in response to the pandemic and need for economic relief and recovery. The economic impact from Federal Grants increased 420% from 2019 to 2020. For example, The Coronavirus Aid, Relief, and Economic Security (CARES) Act was passed by the U.S. Congress in March 2020. This relief package delivered over $2 trillion dollars to provide quick and direct economic assistance. The CARES Act included programs like Paycheck Protection Program (PPP), Economic Injury Disaster Loan (EIDL), as well as $150 billion in direct aid allocated to state, local and tribal governments to distribute locally.
Meanwhile, the economic impact from cultural tourists was more than cut in half between 2019 and 2020. Stay at home orders, fear of traveling and closed venues resulted in a drastic decease in economic impact from travelers who participate in the arts, especially those from outside of Colorado and outside the United States.
Parsons Theatre, Norglenn Arts, City of Northglenn
Parsons Theatre, Norglenn Arts, City of Northglenn
Investments in capital projects, renovations and new facilities occurred all over the metro area. The City of Northglenn built and recently opened the new Parsons Theatre inside their expanded Recreation and Senior Center. There were also major renovations at the Museum of Outdoor Arts’ (MOA) Marjorie Park in Englewood, which houses over 40 artworks from MOA’s permanent sculpture collection. Denver Museum of Miniatures, Dolls and Toys moved from Denver’s City Park neighborhood to Lakewood in Jefferson County. This move enabled the Museum to purchase their building, which will provide significant stability and room for growth for this massive collection of tiny objects.
Jobs
Jobs Snapshot
2019
13,392 Jobs
13% increase from 2017
2020
9,688 Jobs
28% decrease from 2019
Arts, cultural and scientific organizations are major employers in the region. From the data, total jobs are calculated by combining full-time, part-time and contract positions. These contract positions are particularly important, as those are often freelance artists, educators, performers, stagehands, directors, costume designers, conductors, sound engineers, etc. Cultural organizations also employ a range of other positions, from curators and dramaturges to accountants and marketing professionals.
Payroll and taxes are another way to highlight the economic activity generated by the arts. Organizations are paying salaries and service fees to people who can then contribute to the local economy through those wages. These institutions are also huge contributors of tax revenue, even as nonprofits, through seat/sales tax from patrons and payroll taxes for employment.
The Garden, Wonderbound
The Garden, Wonderbound
It took a while for the arts sector to recover the jobs lost since the Great Recession. By 2019, the cultural sector reached a new record-level of employment in the arts at 13,392 total positions, including new records for full-time, part-time and contract roles.
However, due to the devastating and drastic impact of the COVID-19 pandemic, the cultural sector lost a decade of employment growth! Employment in the arts dropped 28% to 9,688 jobs, near where it was in 2011 as we emerged from the Great Recession.
If the entire cultural nonprofit sector was one single employer in 2019, it would have been the largest private employer in the metro region! Even with a sharp decrease in employment in 2020, the cultural nonprofit sector is still in the top 10.
With so many venues shuttered and programs frozen, many organizations had to make difficult decisions about their staffing needs. The largest employment decrease between 2019 and 2020 was for contract workers (32% decrease) and about a quarter of part-time workers (26%). Contract work typically makes up about half of this cultural workforce. These “gig workers” are the most vulnerable, often without a safety net.
Many organizations did whatever they could to keep artists and staff employed or furloughed. Total payroll went from $213 million 2019 to $199 million in 2020, a 6% decrease. Organizations knew how important it was to keep providing cultural experiences to their patrons and to help artists maintain a living.
Rigoletto, Central City Opera. Photo Credit: Amanda Tipton
Rigoletto, Central City Opera. Photo Credit: Amanda Tipton
With their annual summer festival cancelled in 2020, Central City Opera released that over a hundred contractors were going to miss a summer paycheck. They organized a dedicated fundraiser to support their numerous contractors, performers and crew who would have been part of the festival. Thanks to generous donors, Central City Opera surpassed their goal and raised over $300,000.
Wonderbound kept all of their dancers on payroll in 2020, despite having to cancel several major performances. Dancers stayed very busy making instructional “dance along” videos and an extensive series of original dance films featuring local music. Wonderbound created over 120 videos and offered them all online for free.
2019 marked the highest employment in the cultural sector since the start of this study.
Attendance
Attendance Snapshot
2019
15 million people
1% increase from 2017
2020
8 million people
49% decrease from 2019
Attendance comprises people exploring museums, listening to concerts, watching dance performances, hearing live choral singing, experiencing natural and cultural facilities. Total overall attendance aggregates adult and youth participation, as well as paid, free and reduced-price tickets. It also aggregates audience members from within the seven-county metro area and those coming from elsewhere in the state, outside of Colorado and internationally.
For the integrity of the economic activity calculations, CBCA attempted to omit virtual attendance. It is not possible to make the same assumptions about indirect economic activity from virtual participation in cultural activities. Digital and online events varied widely and there was not a consistent methodology for organizations to self-report those attendance and engagement figures. However, it is clear that organizations found various innovative ways to continue connecting with their audiences.
It is clear that people from across the metro area and beyond enjoy a wide variety of arts, cultural and scientific experiences. These range from performances at the Arvada Center or Lone Tree Arts Center, music concerts at Colorado Chautauqua, cultural history exhibits at the Black American West Museum or the Broomfield Veterans Memorial Museum, dance shows at Colorado Ballet or Kim Robards Dance, family-friendly outings at Children’s Museum of Denver, or natural history experiences at Dinosaur Ridge.
Although total attendance reached 15 million in 2019, the highest attendance recorded was in 2007 right before the Great Recession.
However, total attendance in 2020 dropped to 8 million, the lowest it’s been since 1997 – essentially losing two decades of audience growth due to the pandemic.
Colorado Dragon Boat Festival
Colorado Dragon Boat Festival
The impact of the COVID-19 safety protocols, stay-at-home orders, temporary venue closures and capacity restrictions starting in March 2020 was particularly hard for organizations that rely on intimate indoor experiences, as well as big summer festivals, like Central City Opera and Colorado Music Festival. It also impacted organizations with large-scale summer events like Colorado Dragon Boat Festival and CherryArts.
Despite this drastic drop in in-person attendance in 2020, arts, cultural and scientific organizations found many creative ways to still connect with audiences, families and fans. They offered online music classes, virtual concerts, at-home art kits, livestream sing-alongs, instructional dance videos, interactive science experiments, meet-and-greets with animals, and so much more engaging and enriching creative content. And most of it was free of charge!
A TRIBUTE TO R B LEGEND RUTH BROWN featuring Sheryl McCallum, Miners Alley Playhouse
A TRIBUTE TO R B LEGEND RUTH BROWN featuring Sheryl McCallum, Miners Alley Playhouse
Miners Alley Playhouse launched their Quarantine Cabaret series in 2020, which focused on highlighting and broadcasting local performers and musicians. Motus Theater was able to shift to a virtual space, especially for their UndocuAmerica monologue series and Shoebox Stories podcast. This work was very relevant in 2020 as our nation reckoned with its history of racial injustice and discrimination against immigrants. Access Gallery brought their programming to the front porches of their participants, all of whom have intellectual and developmental disabilities. They provided pizza from a local business and a valuable opportunity to connect. Lighthouse Writers Workshop began offering free one-hour workshops to essential workers who had to face the dangers of the pandemic while providing critical services.
2019 marked the second highest attendance in the history of this study.
Giving to the Arts
2019 Snapshot
2019
$213 million
17% increase from 2017
- Individual: $38 million
- Corporate Sponsorships: $11 million
- In-Kind Donations: $25 million
- Foundations: $31 million
- Government: $25 million
- SCFD: $63 million
- Other: $20 million
2020 Snapshot
2020
$225 million
5.5% increase from 2019
- Individual: $43 million
- Corporate Sponsorships: $8 million
- In-Kind Donations: $11 million
- Foundations: $47 million
- Government: $41 million
- SCFD: $63 million
- Other: $12 million
Arts, cultural and scientific organizations compile funding from several sources. In addition to earned income from audience members and other services, there are a range of philanthropic channels that provide valuable contributed income to fuel programs, special events, daily operations and growth.
Total giving to the arts is calculated by aggregating a variety of public and private funding sources, including individual donations, corporate sponsorships, foundation grants, in-kind gifts, government funds and SCFD disbursements. The “foundation” category is an aggregate combination of corporate, private and public foundations grants. The “other” category includes things like endowment income and exceptional situations like special events.
Indigenous Arts of North America Galleries, Denver Art Museum. Photo Credit: James Florio Photography
Indigenous Arts of North America Galleries, Denver Art Museum. Photo Credit: James Florio Photography
Overall giving to the arts has grown every year over the last 10 years. It is the only key metric that increased from 2019 to 2020, going from $213 million to $225 million, a 5.5% increase. The most significant contributors to this increase in 2020 were from individual donors and government grants.
Despite the economic uncertainty during the pandemic, individual giving has been on the rise for the last 15 years.
There was a major increase in government grants in 2020. Federal grants increased 420% from 2019 to 2020 and other government grants for state and local municipalities increased 43% in 2020.
There continues to be volatility in corporate sponsorships in the arts. Sponsorships increased 22% in 2019 over 2017, but then dropped 24% in 2020. Company priorities can shift, and sponsorship support often relies on public engagement and brand visibility. It was no surprise to see a decrease in some of these sponsorships, in-kind donations and other contributions that are usually tied to special events, fundraisers and in-person programs.
One data point that illustrates the shift in business model as a result of the pandemic is the ratio of earned to contributed income. In 2019, 59% of aggregated income was earned and 41% was contributed across SCFD organizations. This ratio flipped in 2020 and 43% of aggregated income was earned and 57% was contributed.
Individual giving to the arts increased by 30% from 2017 to 2019 and then by 14% in 2020.
Education Outreach
Education Outreach Snapshot
2019
4 million children
1% increase from 2017
2020
2 million children
46% increase from 2019
Denver Museum of Miniatures, Dolls and Toys. Image Courtesy of Wendy Littlepage
Denver Museum of Miniatures, Dolls and Toys. Image Courtesy of Wendy Littlepage
Arts, cultural and scientific organizations play a significant role in providing enriching educational and access opportunities to school children in the metro area. Educational outreach aggregates in-school activations, like arts integration in classrooms and assembly performances, school field trips to arts venues, after-school activities for youth, as well as classes and lessons for adults and children.
Kids in animal masks at Sanchez Elementary School, BackStory Theatre
Kids in animal masks at Sanchez Elementary School, BackStory Theatre
Educational outreach stayed relatively constant from 2017 to 2019 with only a 1% increase in total number of children reached – 4 million.
There was a 46% decrease in educational activities from 2019 to 2020, dropping to around 2 million children reached. Not only did the pandemic temporarily close cultural venues in 2020, but it also moved classrooms online too! Even if students were able to attend school in-person, outside visitors, like teaching artists and performances were not allowed. In 2020, school children received an average of 4.8 arts experiences in the year.
Think 360 Arts for Learning launched their Teaching Artist TV, which was a free online platform to support ongoing arts education efforts in Colorado and beyond. These videos, featuring local teaching artists, provided a way for schoolteachers to bring the arts-infused lessons to the virtual classroom. In Summer of 2020, CherryArts partnered with Denver Public Schools, Food For Thought Denver and others to create and distribute free Art Kits to students in need throughout Denver. Organizations like Parlando School of Musical Arts and Swallow Hill offered virtual music classes to continue lifelong learning for all ages.
On average, school children in 2019 received 8.5 arts experiences in the year.
Volunteers
Volunteers Snapshot
2019
41,741 volunteers (15% decrease from 2017)
1.61 million volunteer hours (15% decrease from 2017)
2020
24,247 volunteers (42% decrease from 2019)
887,000 volunteer hours (45% decrease from 2019)
Volunteers packing the Someday House, Denver Museum of Miniatures, Dolls and Toys
Volunteers packing the Someday House, Denver Museum of Miniatures, Dolls and Toys
Volunteer opportunities offer a meaningful way for people to give back to the arts, cultural and scientific organizations they care about. Volunteers also help to offset operational and personnel costs, providing valuable people power. The total number of volunteers and their aggregate volunteer hours are self-reported by SCFD organizations. These individuals participate in range of volunteer positions including ushers, docents, event staff and skilled volunteers like board and committee members.
Parsons Theatre Ghost Light, Northglenn Arts, City of Northglenn
Parsons Theatre Ghost Light, Northglenn Arts, City of Northglenn
There was an overall decline in volunteers in 2019 and 2020, going from 41,471 volunteers and 1.61 million hours in 2019 to 24,247 volunteers and 887,000 hours in 2020. The number of volunteers and their hours are the only key metrics that decreased from 2017 to 2019 with a 15% decline in both. It is possible that this decline in volunteers is related to the increase in employment in the cultural sector, which reached a new height in 2019.
In 2020, there was a 42% decline in the number of volunteers and 45% decline in total hours. Many volunteer positions are connected to in-person events and programs, such as docents, nature interpreters and concert ushers. This drop in volunteers in 2020 can likely be attributed to the impact of the pandemic.
However, volunteers continued to help offset the cost of additional full-time equivalent or FTE employees.
In 2019, volunteers equated to 774 FTE individuals and contributed $47.5 million in donated time.
In 2020, volunteers equated to 426 FTE individuals and contributed $26.8 million in donated time.
Volunteers are still immensely valuable and help to keep operating costs down. The estimated valued of volunteer time is updated every year, state by state, by the Independent Sector.
About the Scientific and Cultural Facilities District (SCFD)
The Scientific and Cultural Facilities District (SCFD) is the only cultural funding model in the nation that serves a region of seven counties: Adams, Arapahoe, Boulder, Broomfield, Denver, Douglas and Jefferson. This broad base has allowed SCFD to grow into the second largest cultural funding mechanism in the United States.
SCFD is a special tax district created within Colorado law, approved by Colorado’s General Assembly and renewed by voters multiple times for more than 30 years.
Just one penny on every $10 in sales and use tax collected goes to SCFD. Annually, that adds up to over $60 million, which is distributed to nearly 300 arts, cultural and scientific organizations ranging in size from volunteer-led community choruses and orchestras to internationally acclaimed museums.
Public funding through SCFD has steadily increased over the last decade. 2019 was a record-breaking year for the SCFD, distributing over $63 million in the calendar year. This was a 12% increase over 2017. Throughout the uncertainty of 2020, public funding through the SCFD proved to be a vital stabilizing force. Funding through the SCFD only declined 1% between 2019 and 2020 based on the data in this study.
It is important to note that this study includes analysis on 98.4% of SCFD funds self-reported by grantee organizations as of December 31, 2020. The unaccounted portion of these funds is due to the timing of distributions, differences in grantees’ fiscal year-end dates and accounting policies. In total, SCFD generated $66 million in 2019 and $64 million in 2020 total. This is a 3% change from 2019 to 2020.
Culture for All. Equity, diversity and inclusion are critical values in the mission of SCFD. Residents pay this tax, and it is then infused back into nearly 300 diverse cultural organizations in the seven-county metro region. This funding makes culture in the community available and affordable to all children and adults.
Life is more colorful with SCFD. Through SCFD, priceless collections of animals, art, plants, natural history and historical sites are being preserved for children and future generations. Cultural experiences plant a seed within children that ultimately impacts their growth into higher achieving students and well-rounded adults.
SCFD makes our community more vibrant. As a vital stabilizing force, SCFD funding was crucial to helping ensure cultural assets could weather unprecedented circumstances.
About the Study
This Economic Activity Study of Metro Denver Culture was written and published by Colorado Business Committee for the Arts (CBCA) on November 4, 2021.
This study was calculated using data from the 2019 and 2020 calendar years. Data was self-reported by the nearly 300 arts, cultural and scientific nonprofits funded by the Scientific and Cultural Facilities District (SCFD) – 287 organizations in 2019 and 288 organizations in 2020. These arts, cultural and scientific organizations reside in the Denver metro area’s seven-county region: Adams, Arapahoe, Boulder, Broomfield, Denver, Douglas and Jefferson. Data comes directly through the SCFD final grant reports from grantees through a partnership between CBCA and SCFD exclusively to produce this report. As a result, there is 100% response rate on the data collection tool.
This study does not include data from non-SCFD funded nonprofits organizations within or beyond the seven-county metro area, for-profit creative businesses, higher education or individual artists. Throughout the study, CBCA references outside research and statistics to provide context, comparisons and trends.
Economic activity and impact are calculated using the Regional Input-Output Modeling System (RIMS II) multipliers provided by the U.S. Bureau of Economic Analysis. The most currently available RIMS II multipliers are based on 2019 regional data and the 2012 national benchmark input-output.
CBCA uses a longitudinal analytical model to track changes over time. The immediate prior study was released in November 2018, examining data from the 2017 calendar year. This is why there are direct comparisons in the study to show changes from 2017 to 2019. This study also draws comparisons to the state of the cultural sector before, during and after the Great Recession, as well as back to the early 1990s when this study began. The Great Recession generally refers to the time period between 2008-2009.
While the majority of organizations in this study have a calendar fiscal year, some organizations’ fiscal year starts and ends in the middle of the calendar year. As a result, there is some incomplete data for the remainder of the 2020 calendar year as the impact of the pandemic continued on. For the purpose of comparison with the 2019 calendar year and the longitudinal data, the model was maintained and enables year-over-year comparisons.
To the extent possible, attendance at virtual-only events was removed, including cultural programs and events offered digitally or livestreamed in 2020. The accuracy and consistency of collecting attendance and engagement data from virtual events and programs cannot be guaranteed. Moreover, the research team could not apply the same economic activity multipliers to virtual attendance. The assumptions for indirect or ancillary audience spending are different and more variable for virtual attendance.
This study includes analysis on 98.4% of SCFD funds self-reported by grantee organizations as of December 31, 2020. The unaccounted portion of these funds is due to the timing of distributions, differences in grantees’ fiscal year-end dates and accounting policies.
All data is presented in aggregate and rounded to the nearest whole number for ease of communication. CBCA does not breakout data by SCFD funding tier, geography or discipline, such as performing arts or natural history. The current SCFD final grant report does not inquire about the demographics of cultural audiences and attendees, with the exception of adult or youth participation.
CBCA has been reporting on the economic and social relevance of arts for 28 years. The first study was published in 1993 using self-reported data from SCFD-funded organizations from 1992. Since then, CBCA has published an economic activity and impact report approximately every other year. For the last two decades, CBCA has partnered with SCFD to collect data as part of the grantee organization’s final grant report process. This model was originally designed by Denver’s Deloitte Consulting Office, and it has been refined over time for consistency and accuracy.
This particular study was originally scheduled to be released in November 2020, reporting on data from the 2019 calendar year. Due to the impact of the COVID-19 pandemic beginning in March 2020, and its severe impact on the arts and cultural sector, CBCA postponed that study. It was delayed in November 2021 in order to include data from both the 2019 and 2020 calendar years.
CBCA would like to acknowledge the convergence of circumstances that provide a backdrop for this report. The impact of the COVID-19 pandemic is an important through line in this data and analysis. In many cases, the shifts in attendance, jobs, economic activity, and philanthropy in 2020 can be directly attributed to the pandemic. The public health safety measures, stay-at-home orders and temporary closures of venues and in-person events had an abrupt, unforeseen, extended and devastating impact on the arts and cultural sector.
However, this was not the only factor at play. America embarked on a reckoning with historical racial and social injustice in 2020. Many arts, cultural and scientific organizations have since been examining their role in perpetuating systems of oppression, holding community conversations about diversity and inclusion, and taking actions to create more equitable environments for cultural access.
There are other external forces that impacted the cultural sector, such as the impact of climate change, poor air quality from summer wildfires, an affordable housing crisis and more. This study does not have data to explicitly demonstrate the implications and outcomes of these circumstances, but it is important to acknowledge them.
At the same time, CBCA recognizes the resilience of our cultural sector. Throughout the pandemic, not a single SCFD-funded organization permanently closed their doors. In fact, many found ways to celebrate their longevity. In 2019, Lakewood Heritage, Culture & the Arts marked 50 years, and both The Upstart Crow Theatre Company and the Lyons Historical Museum reached 40 years. While celebrations were altered or postponed in 2020 due to the pandemic, Cleo Parker Robinson Dance, Colorado Chorale, and Northland Fine Arts Association reached their 50-year milestone and Colorado Ballet recognized 60 years of dance.
There are several individuals and organizations that have made this study possible.
Thank you to Dan Prather, CBCA Board Member and Managing Partner & President at DualDraw. Dan has been on the research team for this Economic Activity Study for the last two decades! The 2021 report is Dan’s tenth study with CBCA, and he has led the process for the past several years.
Thank you to Courtney Boltz and Matt Ederer with U.S. Bank for their hard work on the research team. Courtney and Matt worked closely with Dan to update the longitudinal model with this 2019 and 2020 data. This report would not be possible without their meticulous efforts.
Thank you to Kendal Zimmermann and the whole team at SCFD for their support in compiling all the data and answering questions along the way.
Sincere gratitude to Presenting Sponsor, U.S. Bank, for their financial support of this report and its release event on November 4, 2021. In addition, thank you to sponsors: Pinnacol Assurance, SCFD, CU Denver College of Arts & Media, Colorado Educational and Cultural Facilities Authority (CECFA), Employers Council, Forte Commercial Real Estate and VISIT DENVER.
Thank you to in-kind partners: DualDraw and The Publishing House. Thank you to Footers Catering, Ratio Beer Works and Total Wine for their in-kind support of the release event on November 4.
Graphic design and web development was done by Ligature Creative.
